
Hey Devs,
If any of you have spent significant time in software development, you’ll know that the best way to know what’s going on with code is to make use of a line by line debugger. A line by line debugger allows you to pause code execution in your application in order to:
- Inspect or alter application state.
- See the code execution path, referred to as the call stack, that led to the currently executing line of code.
- Inspect the application state at earlier points on that path.
If you’ve ever done development in Java or .NET before, none of this stuff is all that exciting, but in the Javascript world, where we mostly write our code using text editors, this is something that is sorely missing. This post introduces the Node.js debugging tools in VS Code in a way that’s accessible to programmers who have never used a debugger before.
In order for this article to be both useful and interesting, we need some code to debug. Thus, I’ve chosen to use the NodeJS OAuth 2.0 Sample for QuickBooks project for this purpose. It’s a fairly straightforward OAuth 2.0 implementation. Go ahead and clone the repo from Github.
Next up, you need Visual Studio Code editor available for download here: https://code.visualstudio.com/Download
Once downloaded, launch VS Code and open up the cloned repo on your local machine.
Built-in Debugger
The Visual Studio Code editor has built-in debugging support for the Node.js runtime and can debug any language that gets transpiled to JavaScript. To launch the debugger, click on the debug icon to bring up the debug view. To start the debugger, click on the green play button.
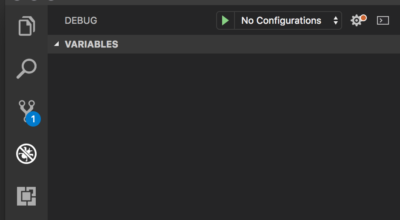
To start the debugger, click on the green “play button”.
Breakpoints
A breakpoint is a marker on a line of code that tells the debugger to pause execution. To set a breakpoint in VS Code, click the gutter just to the left of the line number. I’ve opened /app.js in order to set a breakpoint in the root request listener:
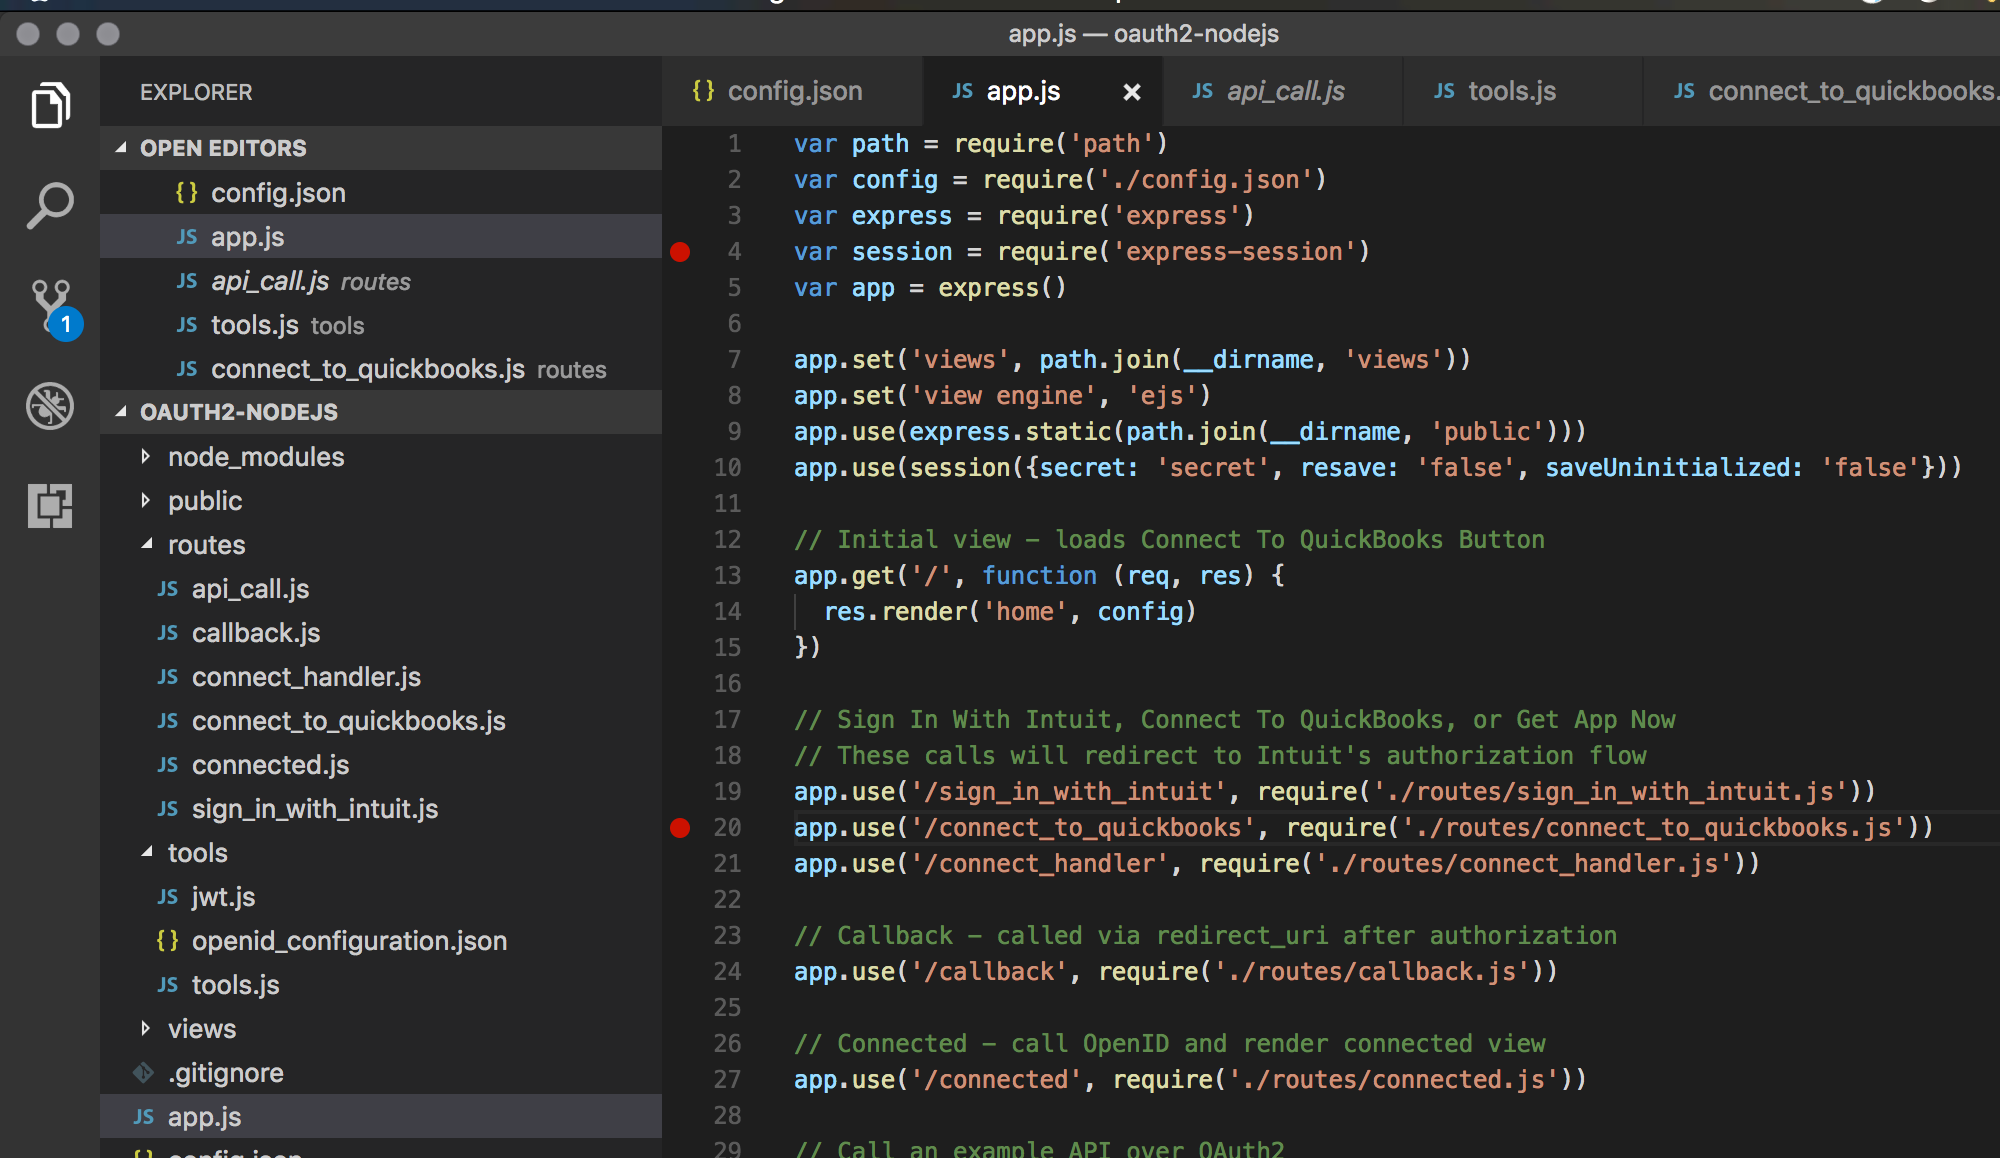
Note that the breakpoints pane at the bottom left has a listing for this new breakpoint.
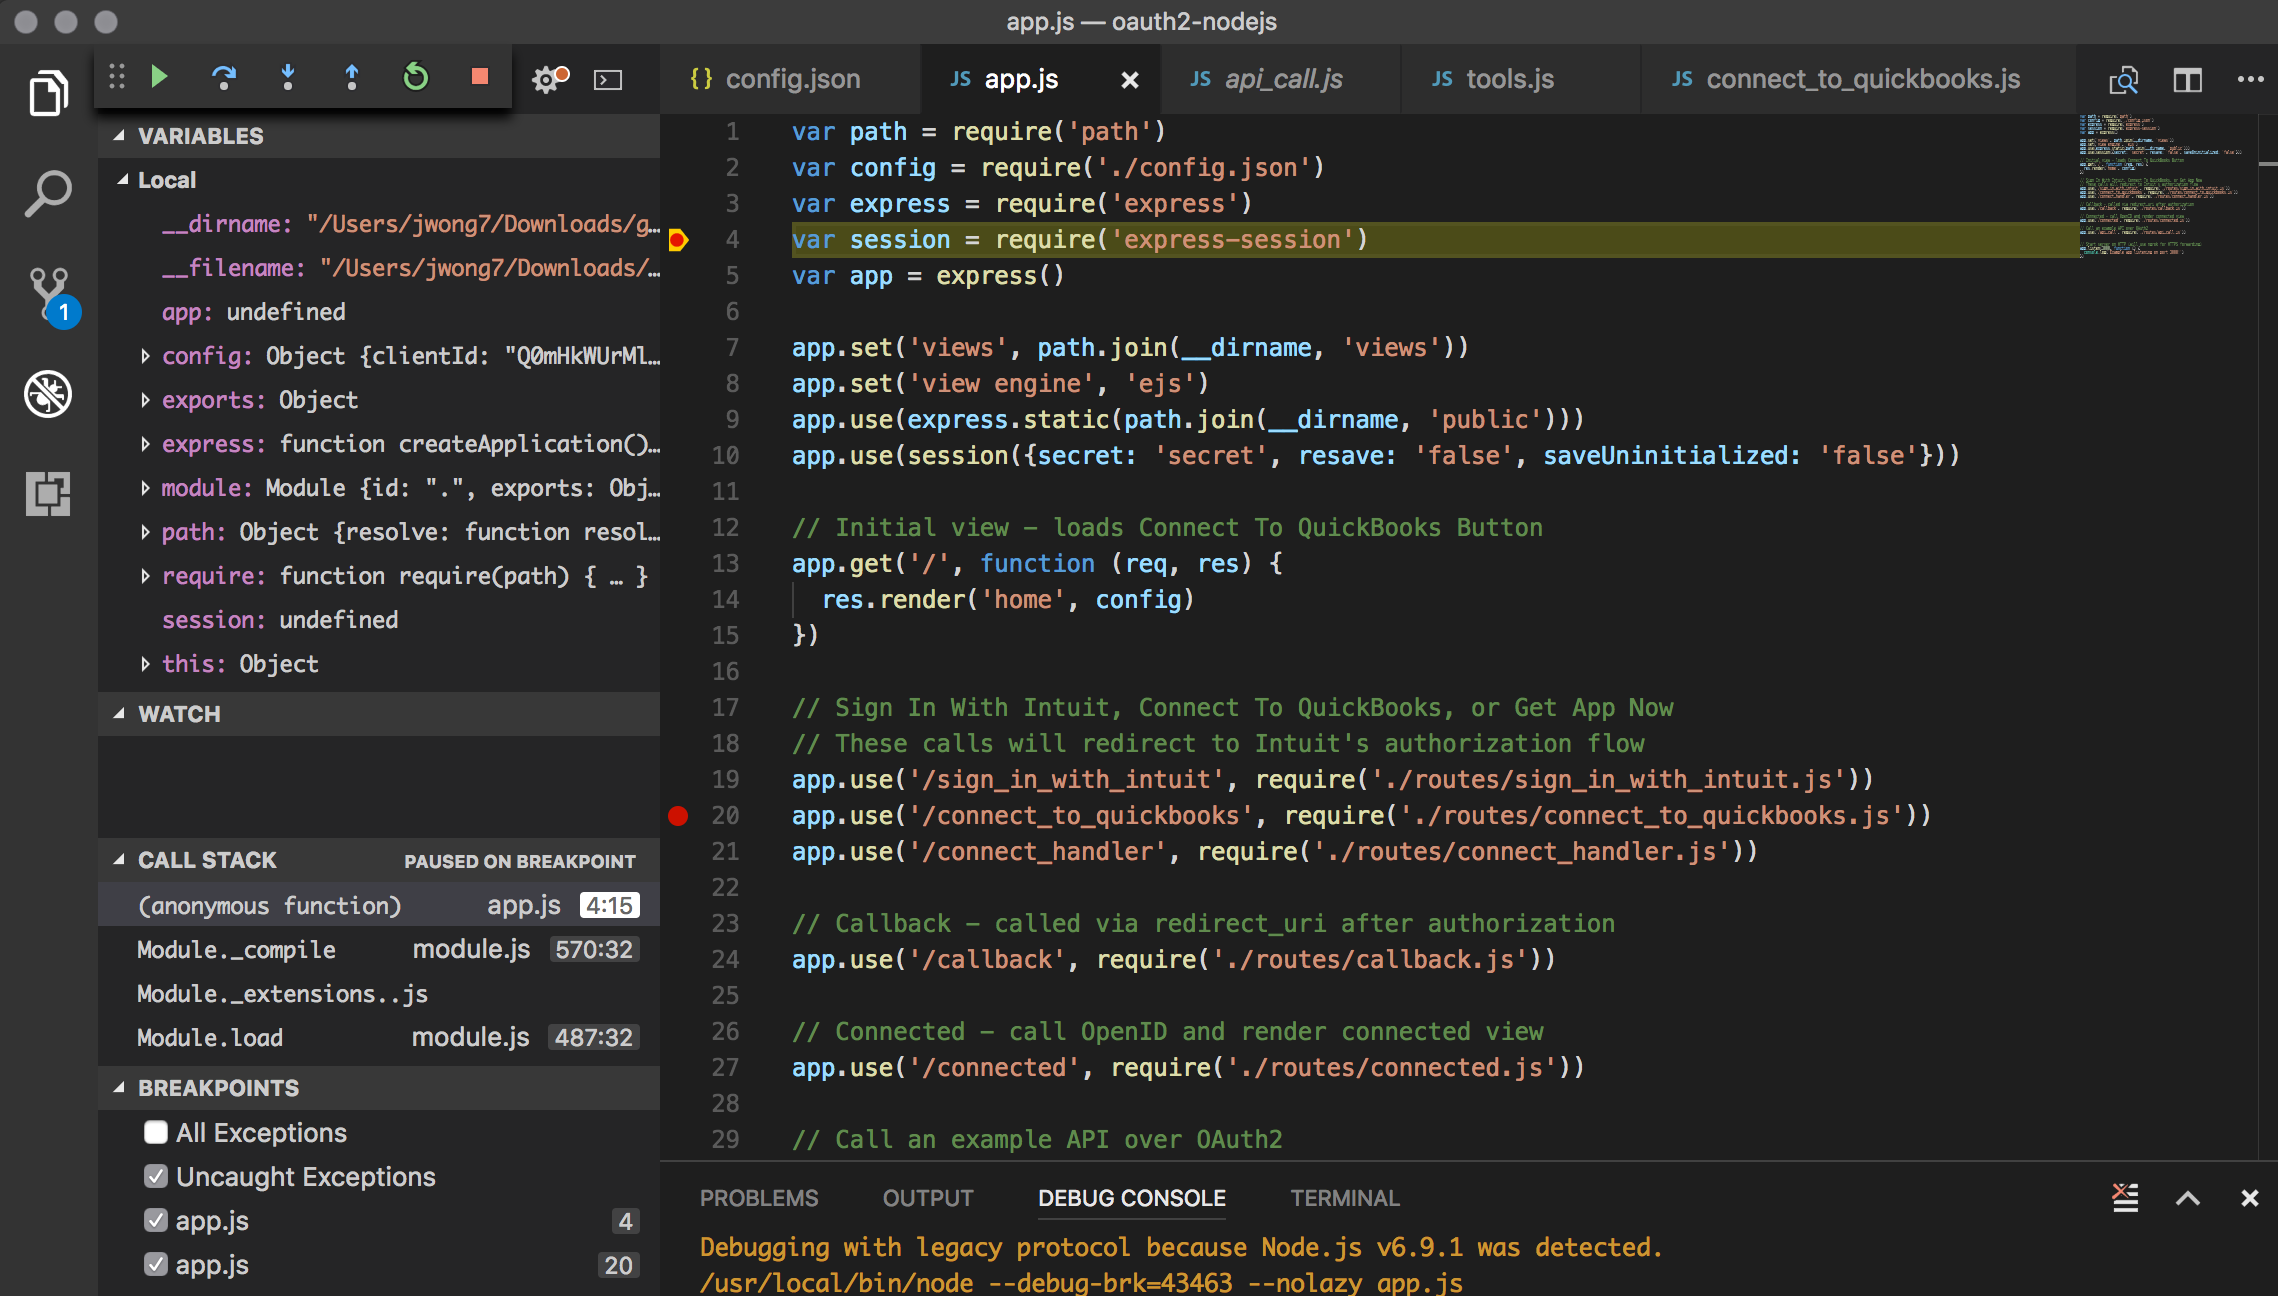
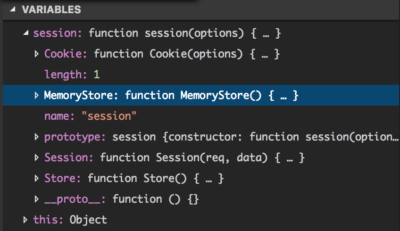
We created a breakpoint at express-session require statement, which if you are familiar with NodeJS programming, you know that this statement will add the express-session package. If you step forward from this statement by using the step forward button, you will see session loaded.
The nice feature here is that you can choose to set a breakpoint anywhere in your code, and VSCode provides a nice snapshot of what’s happening. This is especially useful when you’re debugging and just want to see what your logic is doing to the variables, and it certainly beats having a bunch of console log statements in the command line.
Next let’s put a breakpoint on line 35. We break here to observe that this is where we tell our Express app to use port 3000.
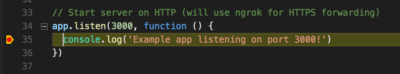
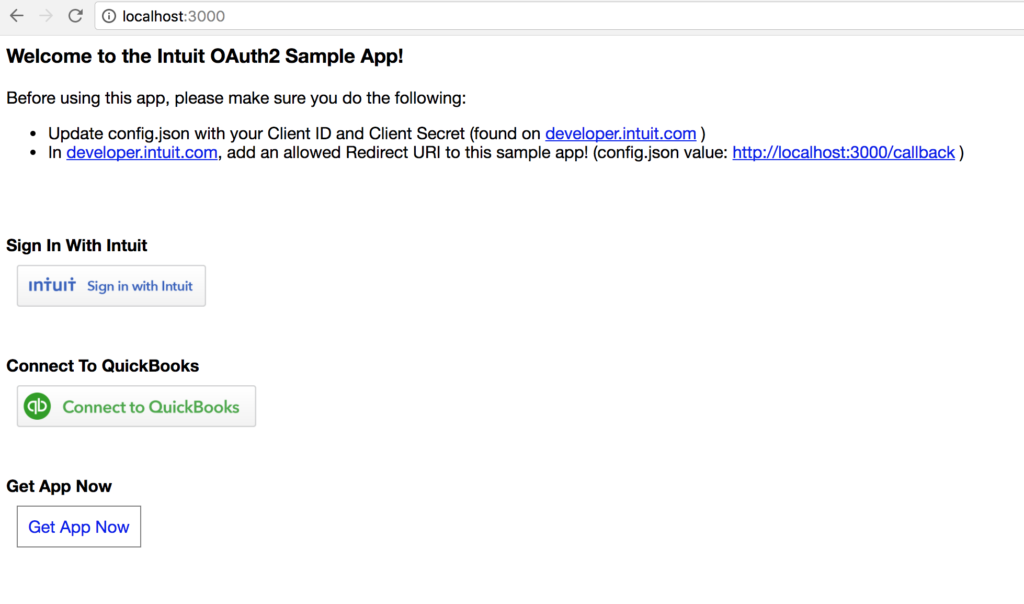
Now, step beyond this breakpoint, and goto http://localhost:3000 in a browser to display the initial view of our OAuth 2.0 sample app landing page.
Like any development environment, it takes some time to get comfortable, but once you know how to use the debugger in VS Code, I’m sure you’ll find it a powerful and useful tool.
Happy Coding!
Jimmy Wong
Leave a Reply